GRAsp
Gene Regulation of Aspergillus fumigatus
Overview
GRAsp is a genome-wide gene-regulatory network that was inferred using the MERLIN-P-TFA package and visualized with the MERLIN-VIZ framework. Data was collected form publicly available RNA-seq data sets from multiple strains of A. fumigatus In each of these data sets a variety of different experimental conditions are observed e.g. exposure to drugs, signals, temperature change, pathogenesis etc. We normalized all data sets and then attempted to learn a regulatory network where we predict the expression of genes using the expression of transcription factors. For more information on the MERLIN inference algorithm see the section What is MERLIN below. We hope that this project provides new insight into the roles of transcription factors and improves general knowledge about A. fumigatus.
How to use GRAsp
MERLIN is a powerful technique for leveraging data from multiple sources and making global prediction of gene regulation. However, interpreting a global regulatory network is challenging due to the large number of predicted regulatory relationships. To overcome this challenge we have developed a visualization framework for our A. fumigatus network called GRAsp. GRAsp allows users to search the gene regulatory network to for network components that may be relevant to their research. Currently GRAsp supports searching the network via a list of genes, searching MERLIN modules, by GO-term, and using network diffusion. To toggle between these choices, select the corresponding search criteria in the search method dialog box.
Searching via a list of genes:
The first of the search methods is labeled Gene List. When selected you can either input a list of gene names in the Input Gene field or Upload a Gene List file containing a list of genes, one gene per line. Lets, start by entering srbA into the search field, with the Include Module Members option selected (default). This will visualize the MERLIN Module containing srbA.
While GRAsp was designed specifically for the Af293 A. fumigatus strain, many of the predicted relationships may also be useful for understanding the CEA10 strain. To this end we have included 1-1 orthologs as searchable options in the Gene List search field. For example searching by AFUB_018340, the 1-1 ortholog of srbA will return the same network.
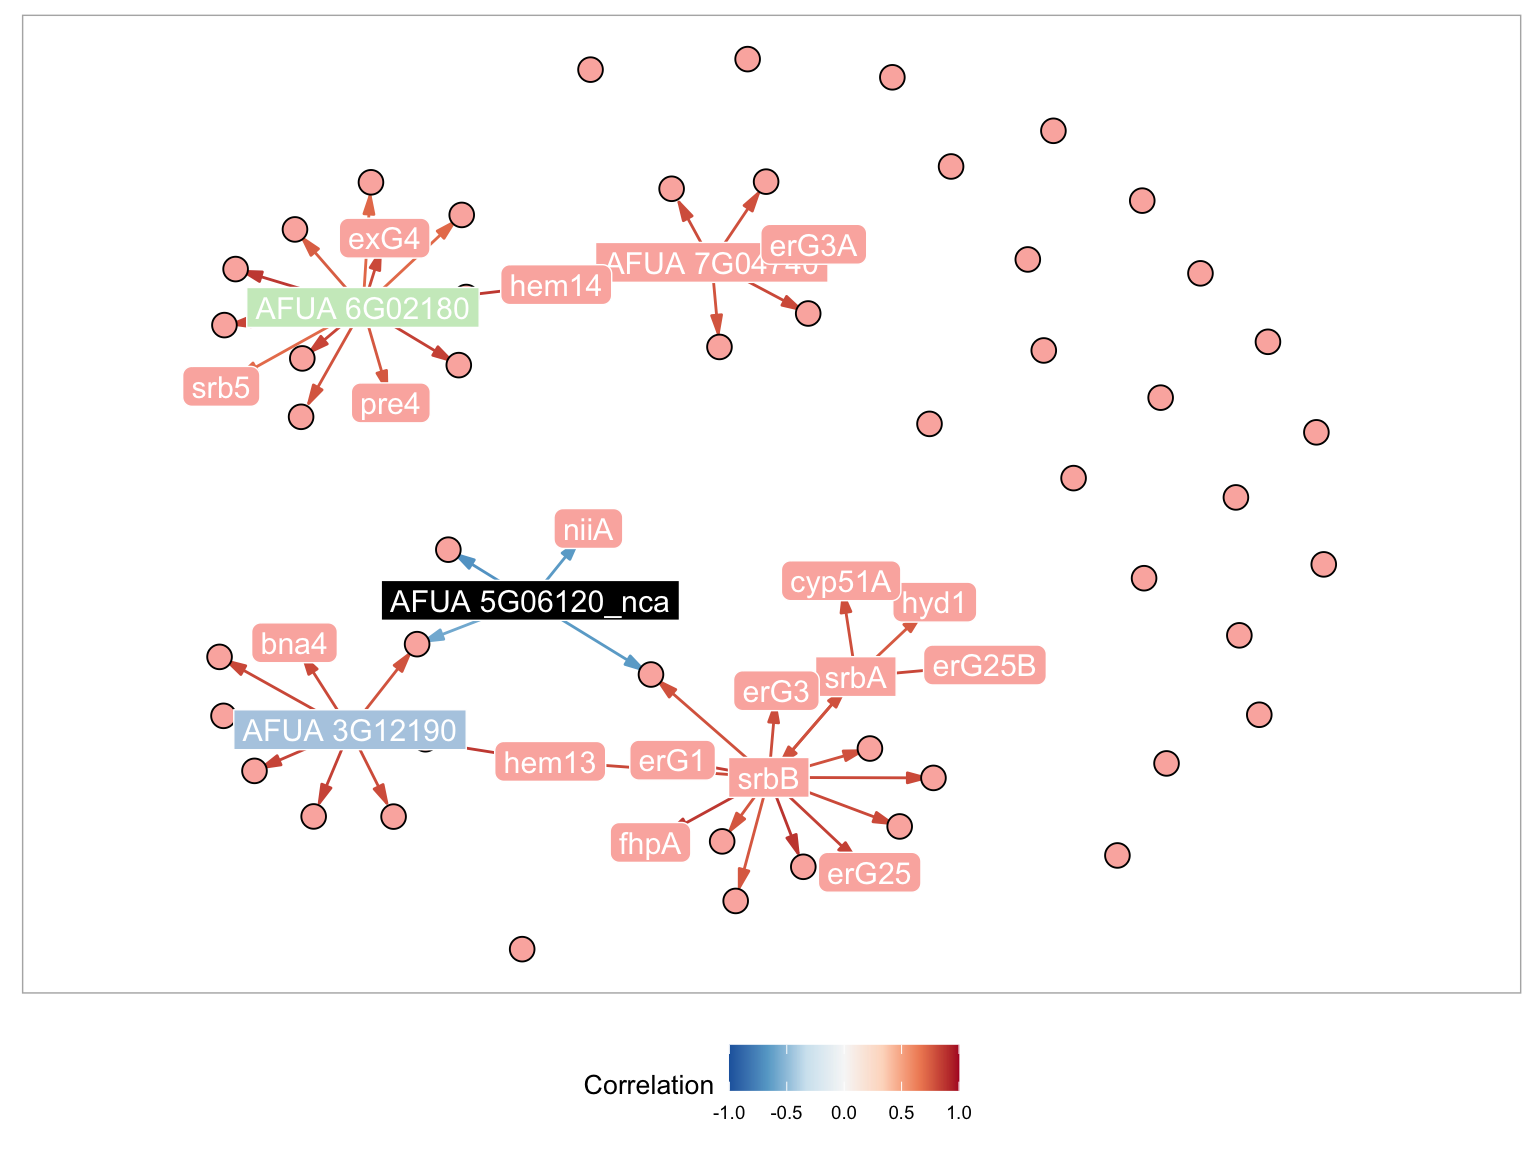
A MERLIN module is a collected on genes which are co-expressed and co-regulated. In the network visualization squared nodes correspond to transcriptional regulators and circular nodes correspond to targets. For example in the plot below, srbA and srbB represent two transcription factors. They are included in the set of candidate regulatory genes at the beginning of network inference. In comparison erG25 erG3 and erG1 are not included in the set of candidate regulators because they do not have any known role in gene transcription regulation. They are each represented with rounded corners. Predicted regulatory relationships are captured with directed arrows. In the plot above srbB is a predicted regulator of erG3, erG1 and erG25. It is also possible to have predicted regulatory relationships between regulators. In this case srbA and srbB co-regulate each other, which is represented by double sided arrow.
The figure above is colored so that nodes within the same module are all the same color. It is possible to have regulators that are in other modules (such as AFUA_3G12190) which is a second module, or that are not assigned to any module (such as AFUA_5G06120_nca, which are colored black). Genes with the suffix nca indicate transcription factor activity profiles (TFA) of a gene, instead of a the gene expression profiles. These TFA profiles are informed by motif information and candidate target gene expression profiles. In practice, regulatory relationship between TFA profiles and expression profiles are both indicative of transcriptional regulation.
Modifying graph apperances
There are multiple ways to modify the figures to increase legibility and remove redundant nodes. Below are a list of supported plotting parameters:
| Parameter | Description | Options |
|---|---|---|
| Node layout | Supported algorithms for generating a node layout. Changing these may improve legibility based on the subgraph topology. All layouts are implemented with the igraph Package | Fruchterman-Reingold, Davidson-Harel, Kamada-Kawai, and Large graph layout. |
| Minimum number of genes in component | The minimum number of nodes required to display a connected component of the subgraph. For example setting this value to two remove genes without reulatory relationships from the visualization | |
| Display gene names | A list of gene names to display in the figure. Note gene names can also be toggled by clicking on individual genes in the display. | All gene names in the figures |
| Name format | If common, a common gene symbol will be used in place of the systematic name when available. Otherwise the systematic name is used for all genes. | Common, Systematic |
| Name in node | If selected, the name of the genes will be displayed within the node. Otherwise, the gene names will be printed on top. | |
| Node color by | Coloring key for genes. If module, the genes are colored by there MERLIN module membership. If regulator, regulators are colored red and non-regulators are colored blue, If Gene name, then genes with similar gene symbols are colored the same. For exampled all erg genes will be labed with the same color | Module, Regulator, Gene Name |
| Node color palette | The palette to label the nodes | Options are the Rcolorbrewer qualitative palettes |
| Node size | Controls the node size | |
| Node label font size | Controls the fond size of node labels | |
| Edge color by | Method for coloring edges. Regression Weights correspond to the learned weights from MERLIN. | Correlation, Regression Weight |
| Edge color palette | The color palette used for edges. | Options are the Rcolorbrewer diverging palettes |
| Expand X axis | Adds or reduces white space along x axis. Used to fit labels. | |
| Expand Y axis | Adds or reduces white space along y axis. Used to fit labels. | |
| Legend font size | Scales the legend font size | |
| Image height (in) | The image height in inches. Effects figure after saving. | |
| Image width (in) | The image height in inches. Effects figure after saving. | |
| File name | The name of the file used when saving. | default (file_name) |
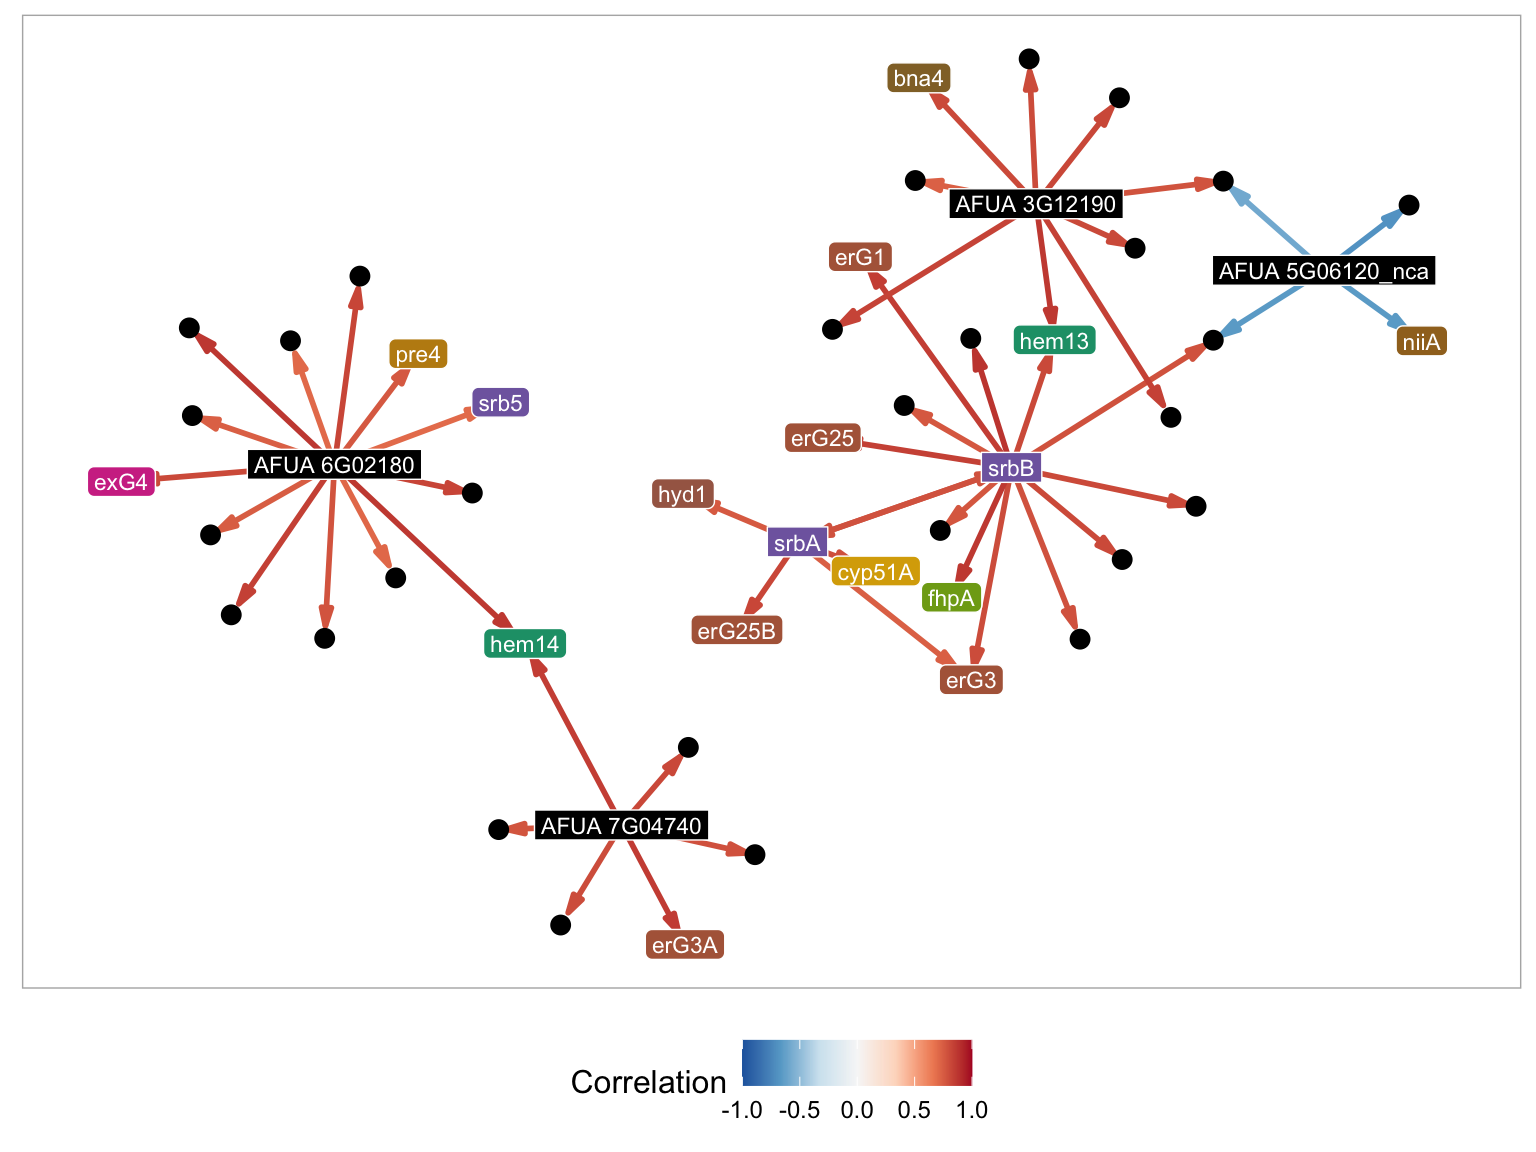
Utilizing the following setting reproduces the figure 3B. of the paper. - Node Layout - Davidson-Harel - Minimum number of genes in component - 2 (removes modules genes without confident regulators) - Display gene names - cyp51A, erG25B, hyd1, srbA, srbB, erG3, erG25, fhpA, erG1, hem13, niiA, AFUA_5G06120_nca, AFUA_3G12190, bna4, srb5, hem14, exG4, erG3A, pre4, AFUA_7G04740, AFUA_6G02180 - Name in node - Selected - Node color by - Gene Name - Node color palette- Dark2 - Edge color by - Correlation - Edge color palette - RdBu
Including additional genes buttons:
There are multiple extension to the search by gene list method. These are in the Additional Options section. These options include how additional genes are added to the list of genes in the Input Genes field. The options include:
Show Neighbors - For each gene in the gene list, show all of the genes immediate neighbors as well as the current genes in the input list.
Include Module Members - For each gene in the gene list, find the MERLIN module that contains that genes, and display all genes and all regulators associated with the module.
Create Steiner Tree - If this is selected a estimated minimum tree connecting the genes in the graph is selected and displayed.
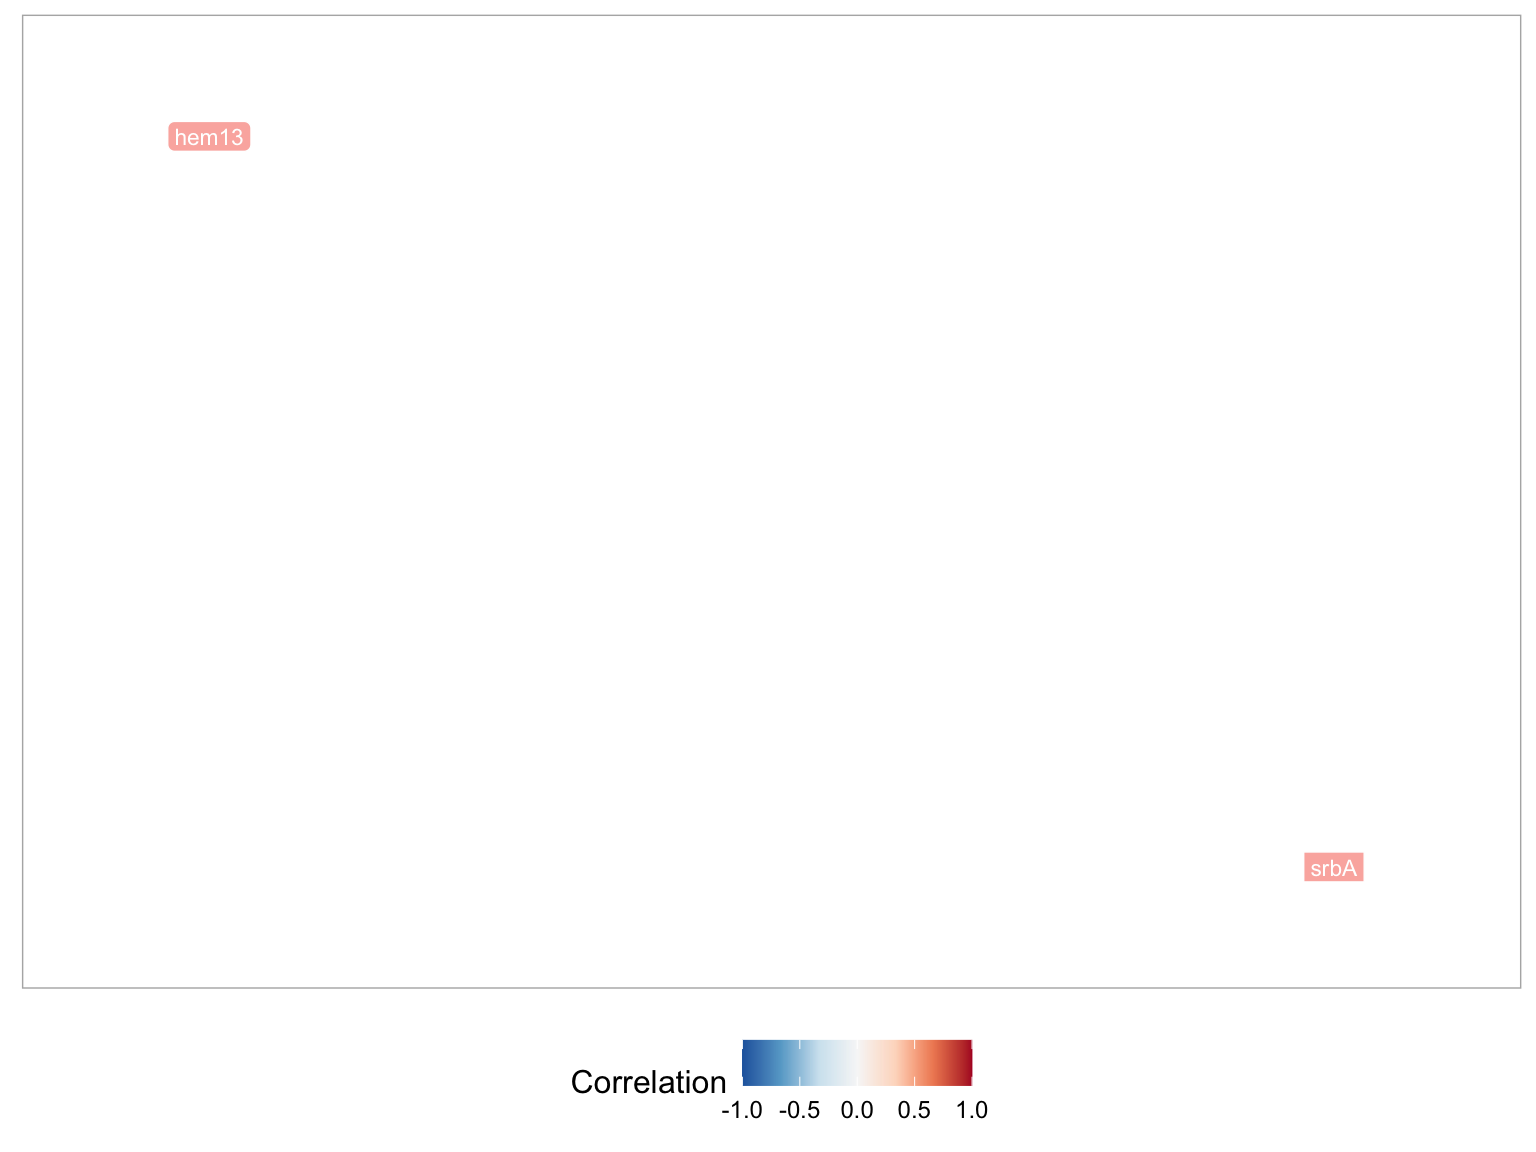
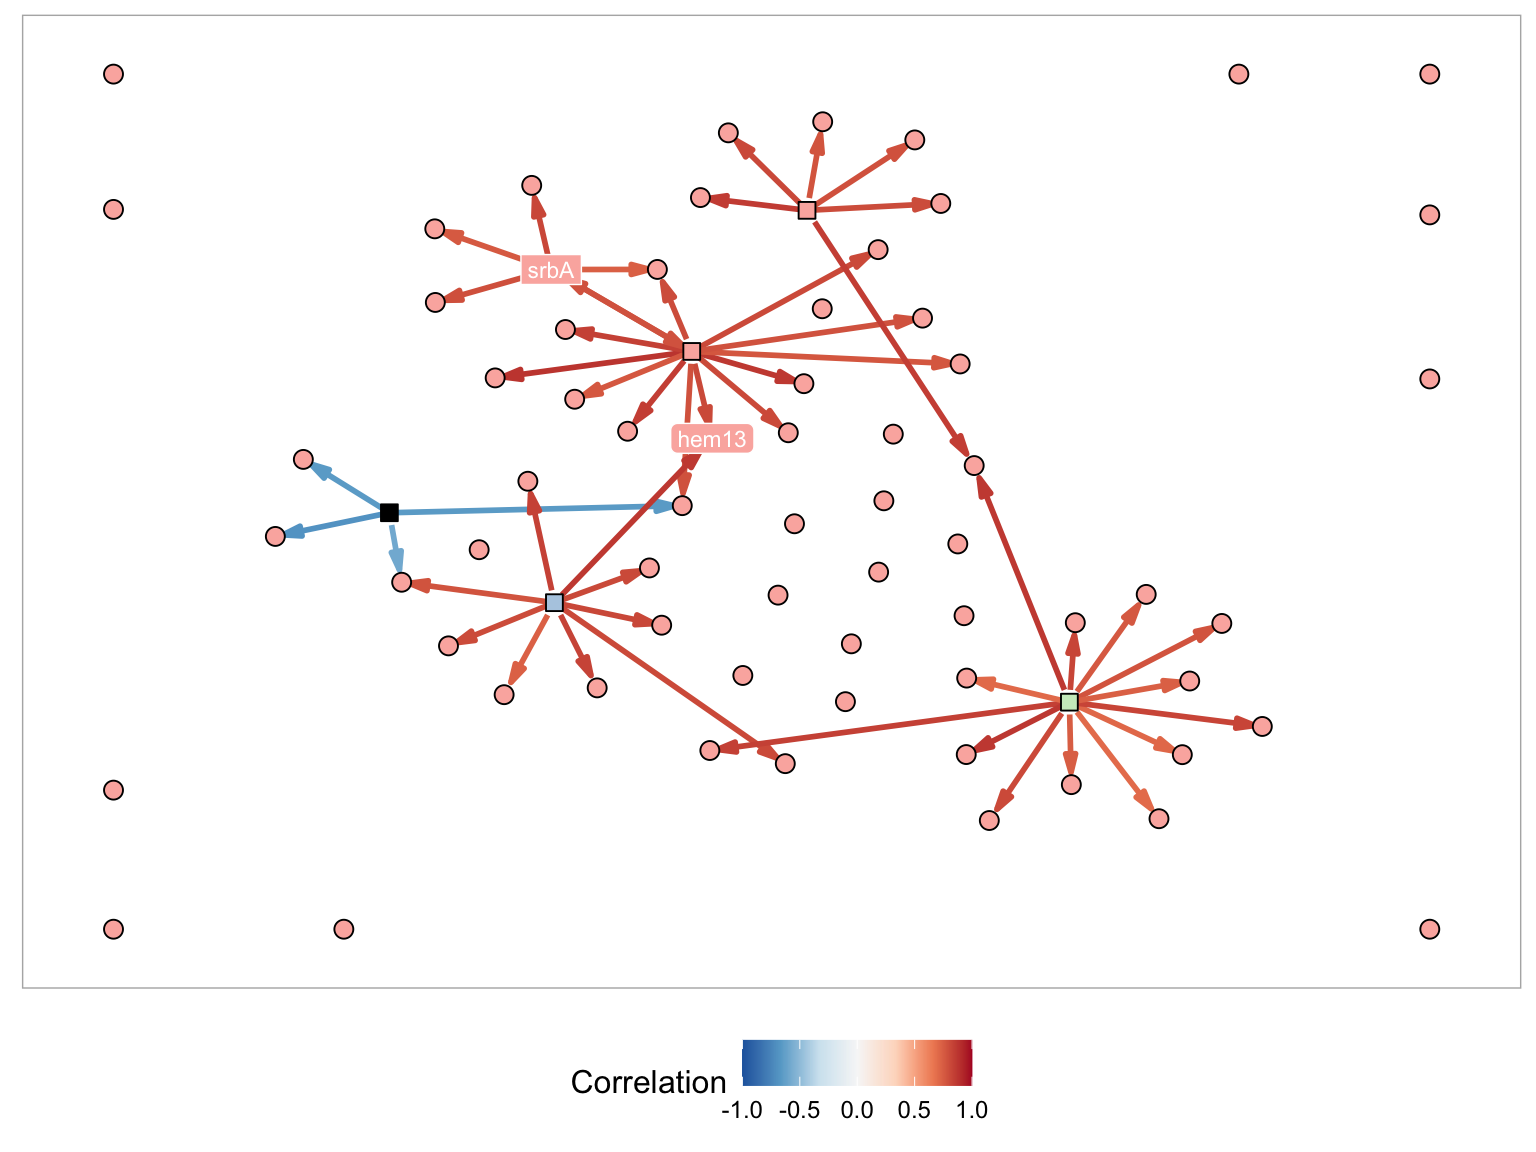
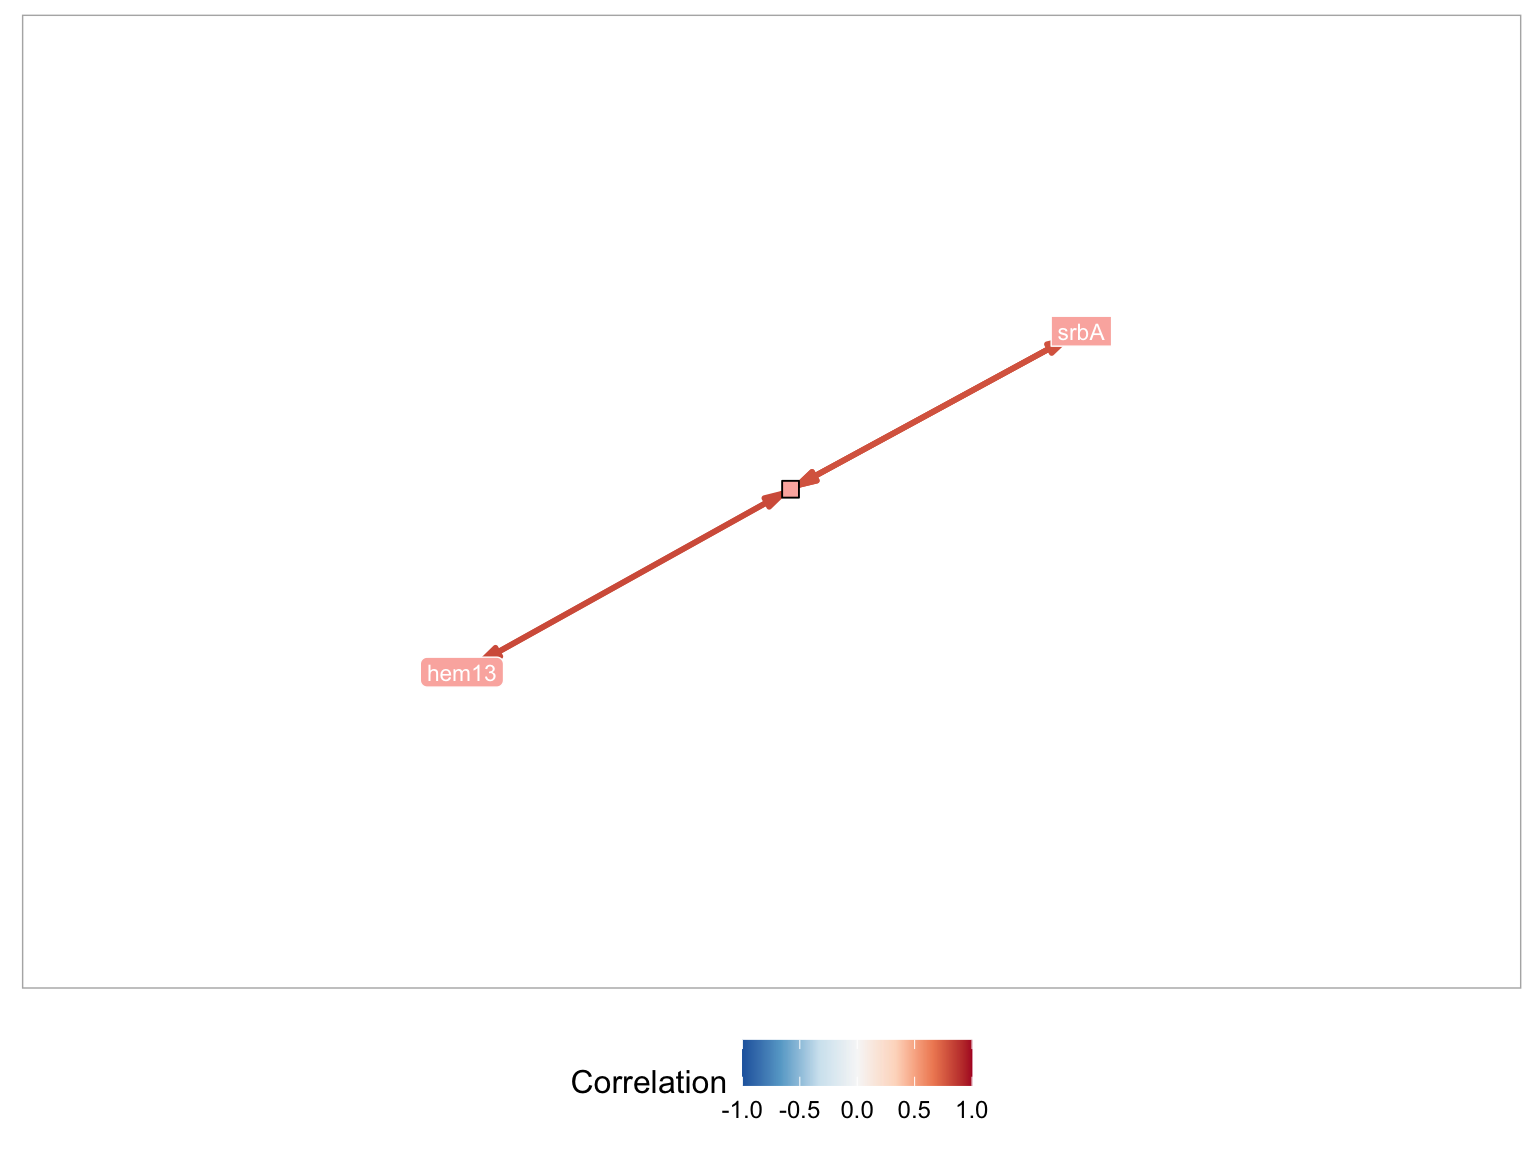
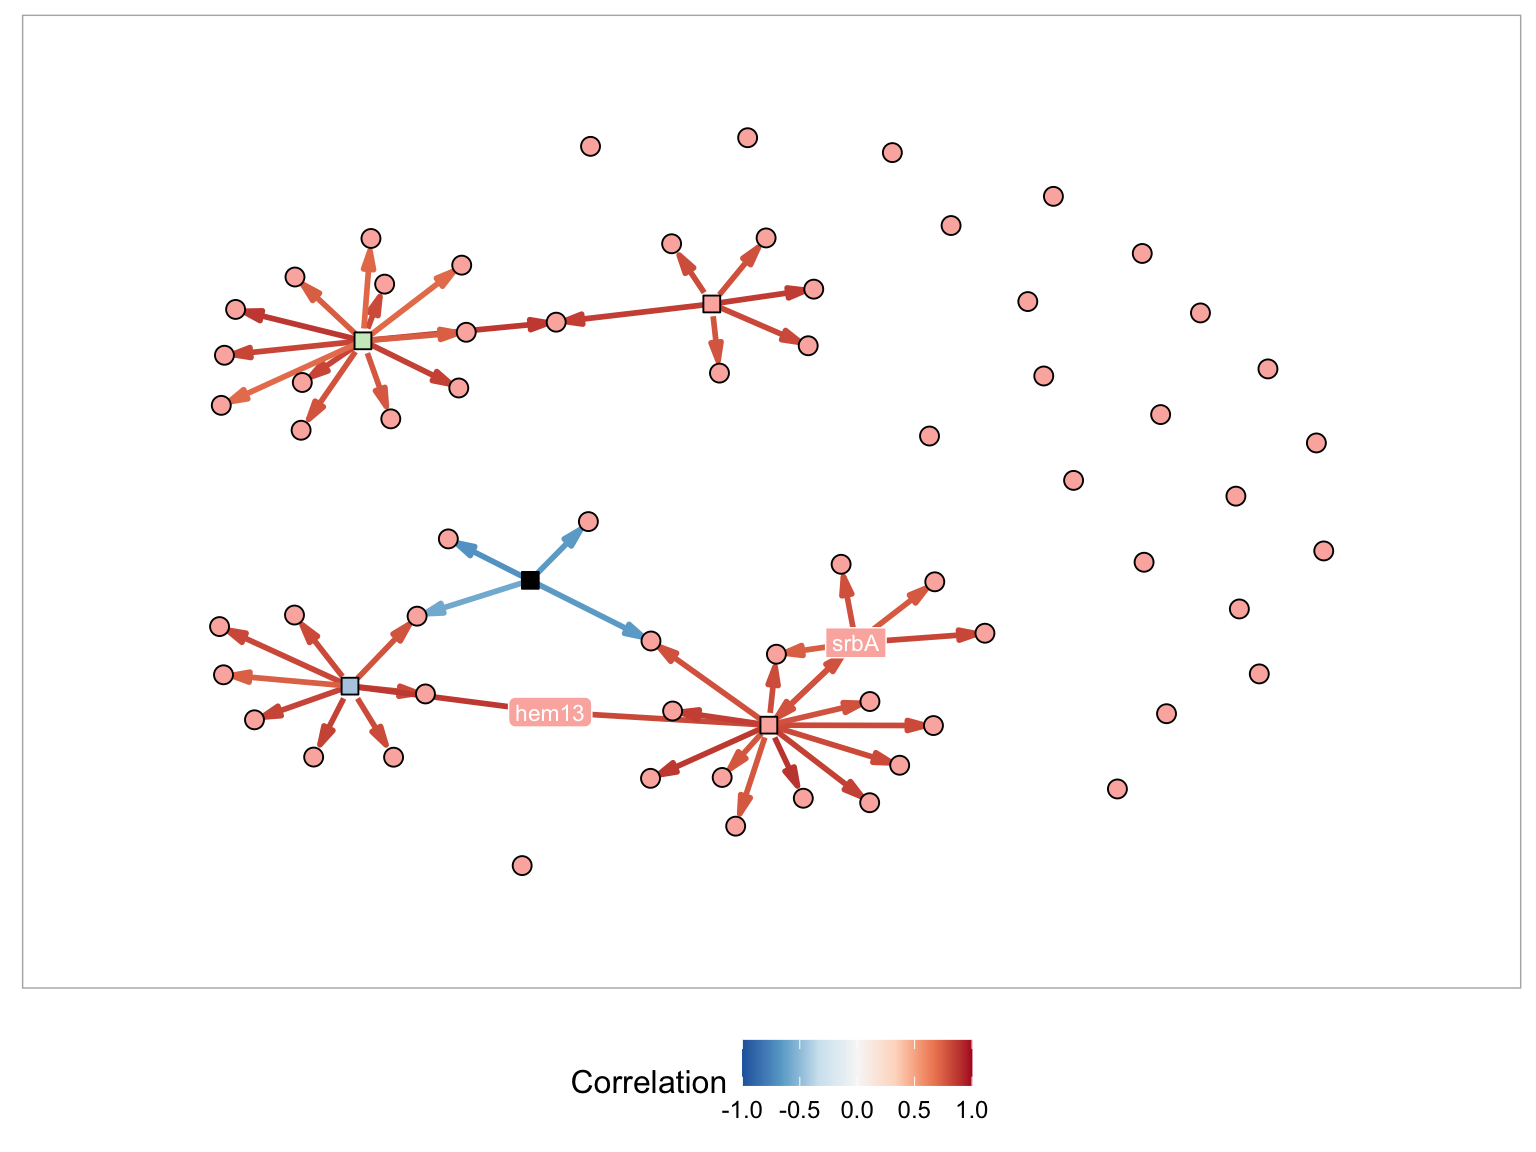
Below is an example with two genes (srbA and hem13) and each of the different methods applied. For each of the figures I am using the following plot parameters:
- Node Layout - Davidson-Harel
- Minimum number of genes in component -1
- Display gene names - hem13, srbA
- Name in node - Selected
- Node color by - Module
- Node color palette- Pastel1
- Edge color by - Correlation
- Edge color palette - RdBu
SrbA and Hem13 with no additional options
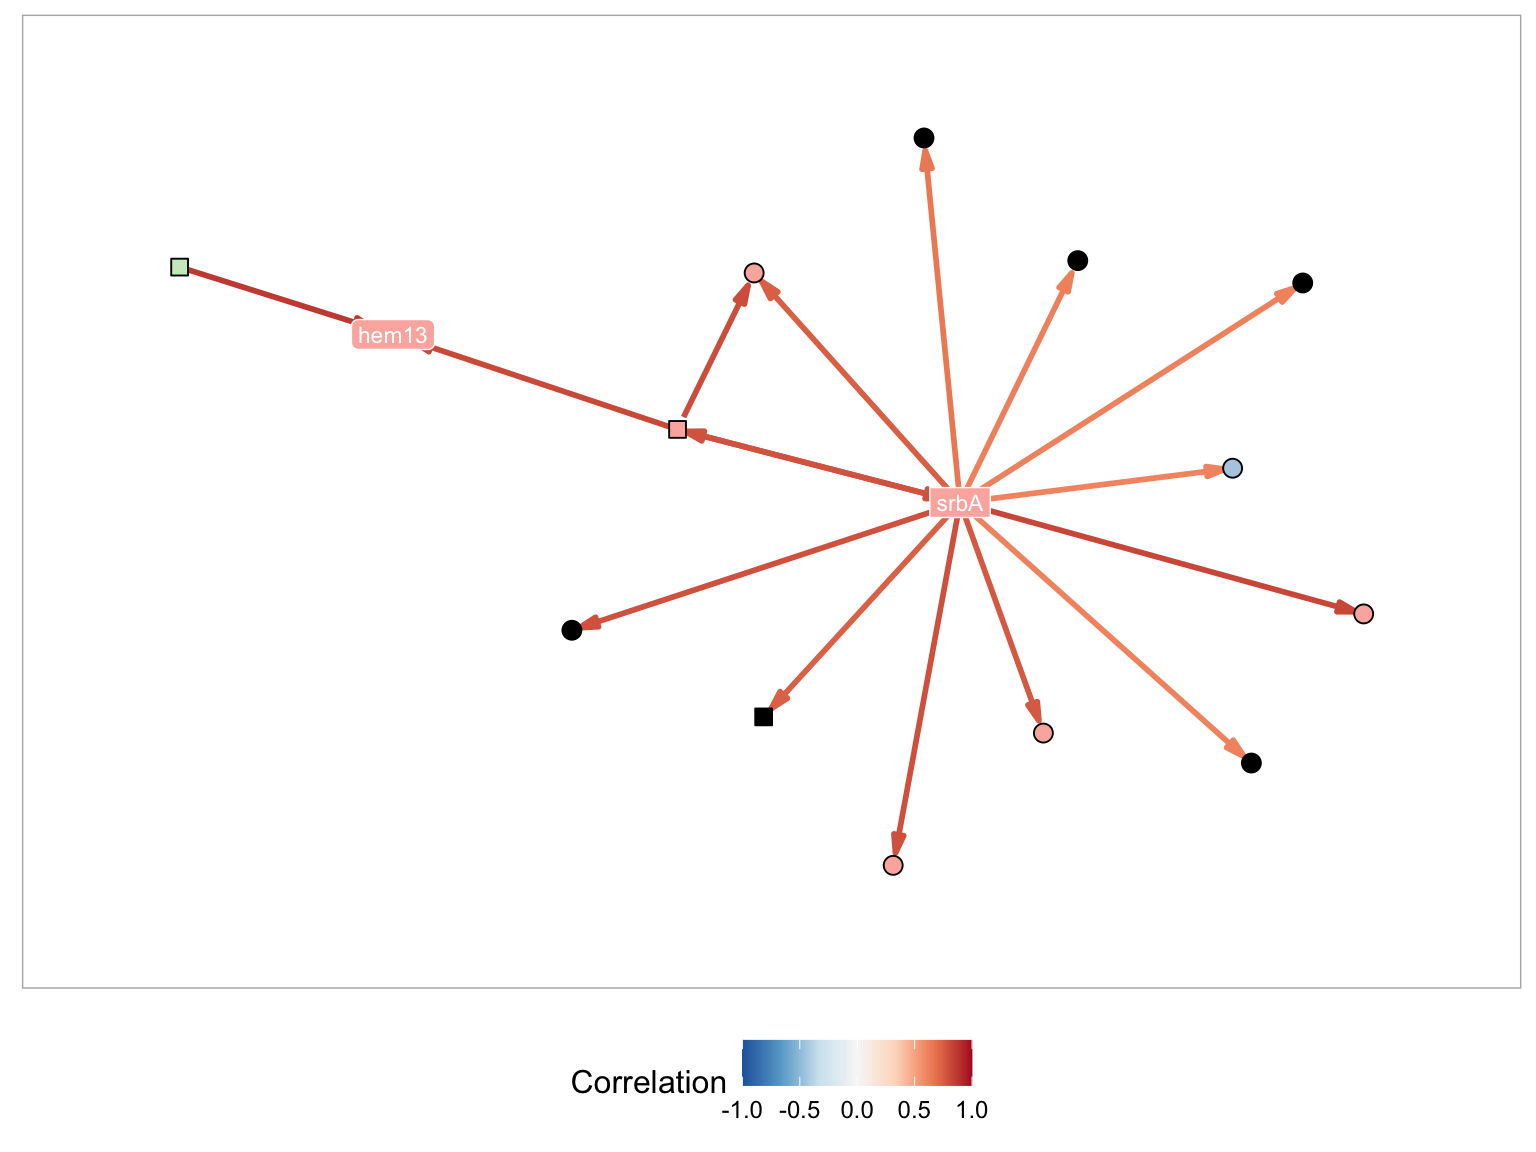
SrbA and Hem13 with neighbors
SrbA and Hem13 with genes in module
SrbA and Hem13 with Steiner Tree
Search using MERLIN modules
GRAsp supports searching for genes directly by MERLIN module id. While the module ids are not ordered in any particular way, searching by modules can be useful when a module id is already known.
For example, the module associated with srbA and srbB is 5395. By setting the Search Method to Modules and the Module ID fields to 5395, the previous module figure will appear.
Search via GO term
The search method allows you to identify MERLIN modules which are associated with specific biological process. Briefly, we utilized a hypergeometric test to test each MERLIN modules genes for enrichment of biological process gene ontology.
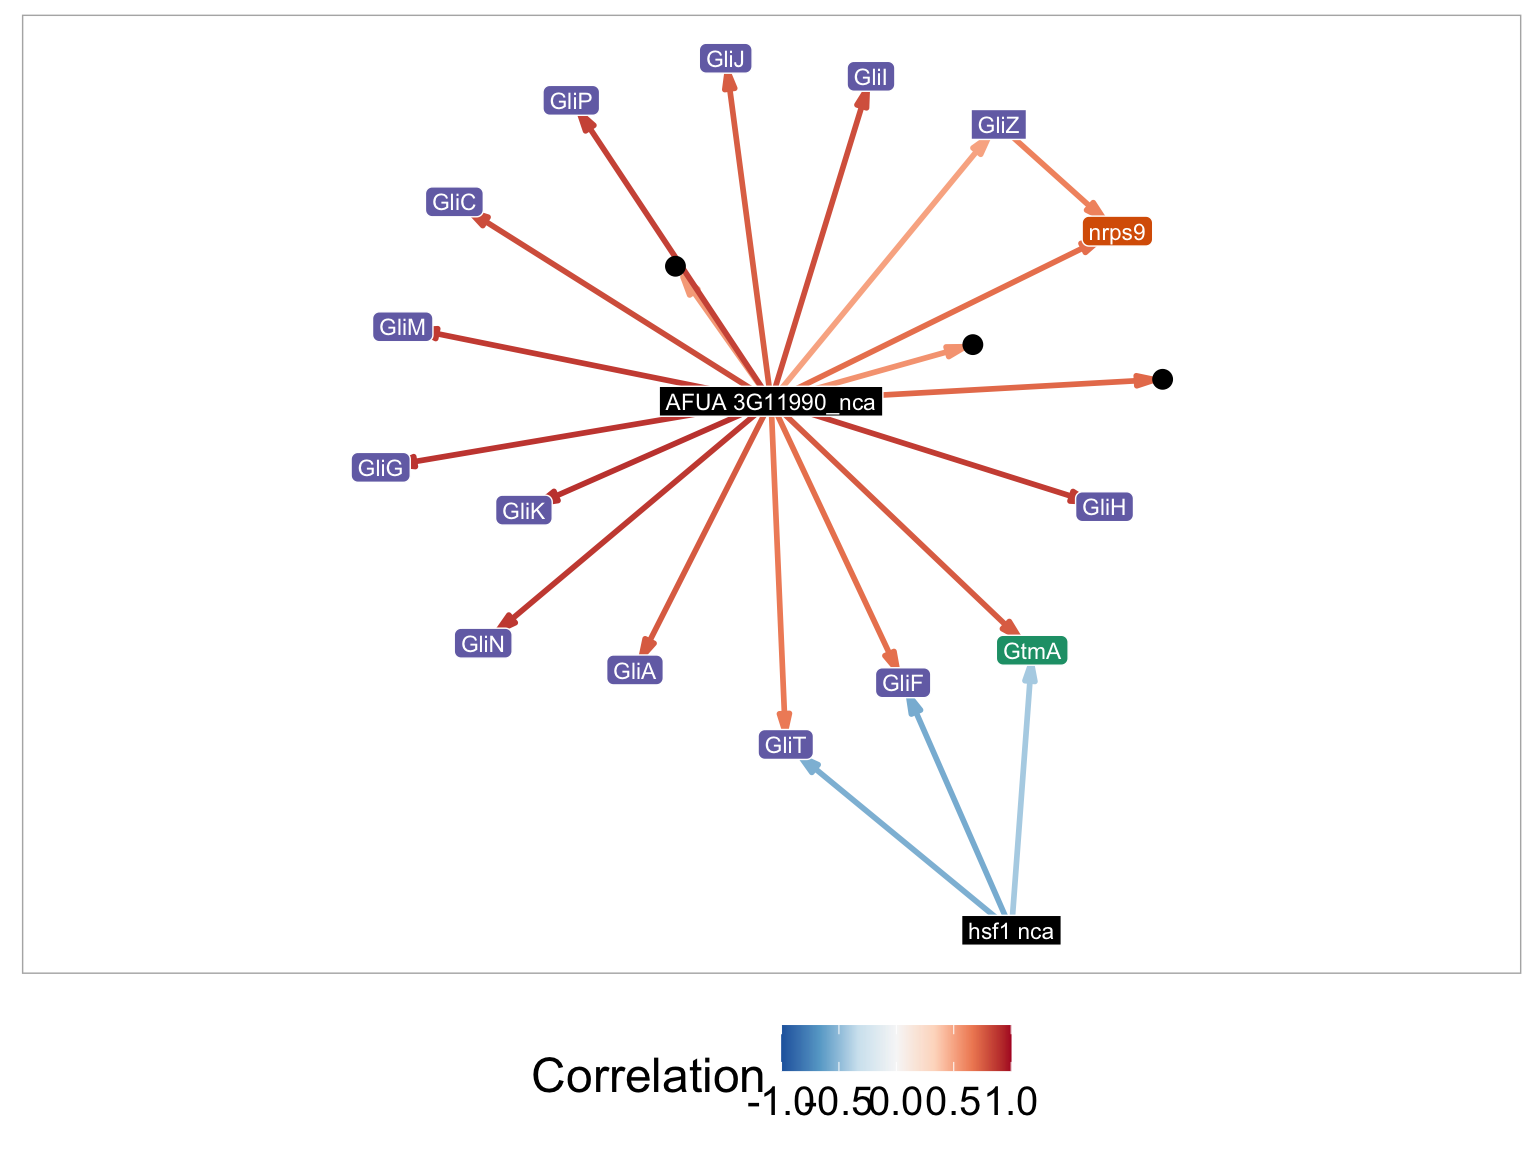
For example if Search Method is set to GO-Term, and GO_terms is set to gliotoxin metabolic process. The plot parameters for the figure are listed below:
- Node Layout - Kamada-Kawai
- Minimum number of genes in component - 1
- Display gene names - GliZ, nrps9, GliI, GliH, GliP, GliC, GliM, GliG, GliK, GliN, GliK, GliN, GliJ, GliA, GliT, GliF, GtmA, hsf1_nca, AFUA_3G11990_nca
- Name in node - Selected
- Node color by - Gene name
- Node color palette- Dark2
- Edge color by - Correlation
- Edge color palette - RdBu
Seach via network diffusion
The final method used to identify subnetworks is node diffusion. This method allows you to incorporate additional data with the network to prioritize components of the subgraph which may result in variation of gene expression. A common example of additional data that can be incorporated are differential expression p-values or log fold changes.
The required input file should be a list of genes followed by an associated value and should be tab delimited. When this mode is select, all nodes will receive a score. The user can select the top percent of nodes to display. The results of diffusion have to be analyzed within the context of the initial data. If the log fold p-value is used, then the output diffusion score will indicate the importance of the node to a particular experiment. When using this search method, node sizes are scaled in the network visualization frame to demonstrate their importance.
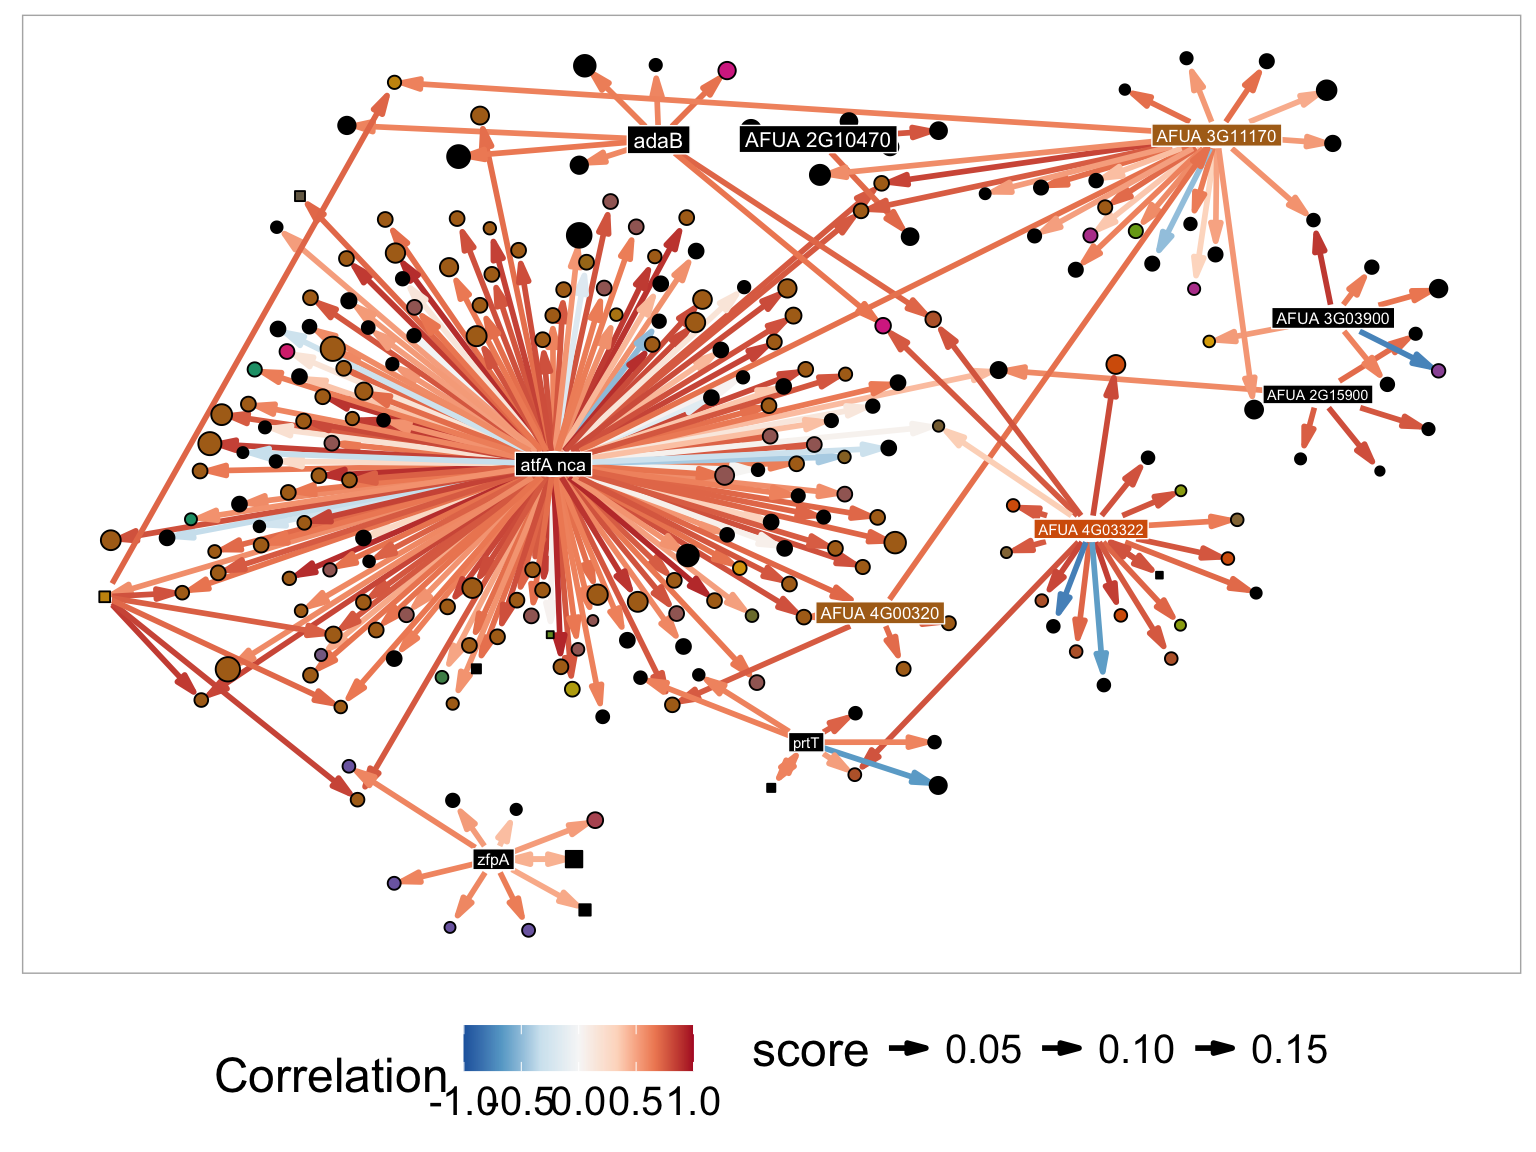
Below is an example of node diffusion using differential expression log fold changes after the first 30 minutes of exposure to LCOs. The diffusion is is effected by a hyperparameter which controls the diffusion bandwidth. A kernel is computed for multiple different . Additionally we provide hyperparameters to filter the results based on regulator properties. First we provide the Min # Of Targets which filters the set of candidate regulators based on their out-dgree. Second, we restrict the top regulators to display based on their diffusion score, # of Regulators to Display.
To generate the AtfA diffusion results in the paper, we used the log fold change values associated with the fir 30 minutes of exposure to LCO and the following plotting parameters:
- Min # of Targets - 5
- Lambda Score - 10
- # of Regulators to Display - 5
- Node Layout - Davidson-Harel
- Minimum number of genes in component - 1
- Name in node - Selected
- Node color by - module
- Node color palette- Dark2
- Edge color by - Correlation
- Edge color palette - RdBu
Gene Table
GRAsp also provides a tabular view of the display data which may be useful for identify genes in the visualization field quickly. Information related to the gene can be viewed by clicking on the Gene Table tab above the visualization window.
- Gene Name - this is the systematic name of each gene. Each of these also acts as a hyperlink to fungi-db page.
- module - The genes MERLIN module assignment.This is the number to use in the search my module box if you want to look at a set of related genes. If a gene is not assigned to a MERLIN module this field will be empty.
- go - The gene ontology terms related to the gene of interest.
- Common Name - if there is a common gene name it is displayed here. Otherwise it is the systematic name. All names are based on the fungi-db database. There could be names that are missed due to fungi-db not being up to date. Also, sometimes a gene has two names due to being named by two different labs, e.g. FumR is also called FapR (the transcriptional regulatory of the fumagillin/pseurotin gene clusters).
- Description - This is fungi-db description of the gene function.
- Orthologs - These are the CEA10 orthologs of each Af293 genes displayed in the network. A full list of orthologs is provided for each Af293 genes. Genes with a single ortholog (1-1 mapping) are searchable.
- neighbors - A list of genes that are connected to the gene listed under Gene Name. This is only as good as the latest analysis. It is helpful for you to do your own blast analysis.
- degree - The number of genes in the neighbors list.
The current nodes table can saved by clicking on the download tab and selecting the desired file format.
Below is an example node table for the srbA-srbB module.
Module table
The module table is used to give additional information on all modules in the that have nodes in the network display. Each column can be sorted by an ordering placed on the column (alpha-numeric ordering). Below is a brief description of the elements in the module table.
- module - The current module number.
- Genes on List - these are the gene that match the current search criteria that are on the module.
- Genes - A list of all genes in the module.
- Gene list enrichment p-value - This shows the enrichment p-value of the genes on list. Lower p-values indicate a better match to the search criteria. For more information see the note on enrichment below.
- GO - A list of associated GO terms. Each GO term is displayed, followed by its enrichment p-value, then followed by all the genes in the module that have the associated p-value. For more information see the note on enrichment below.
- Regulators - A list of enriched regulators in the module. Each enriched regulator is displayed, followed by its enrichment p-value, followed by a list of its targets within the module. For more information see the note on enrichment below.
The current module table can be saved by first placing a name in the Save File box. Then hit the download button. The table can be saved as an csv, excel, or pdf format.
An example module table for the srbA-srbB module is below. Not that multiple module are displayed in the table because some regulators are are also enriched regulators for other modules.
Gene Expression Heatmap
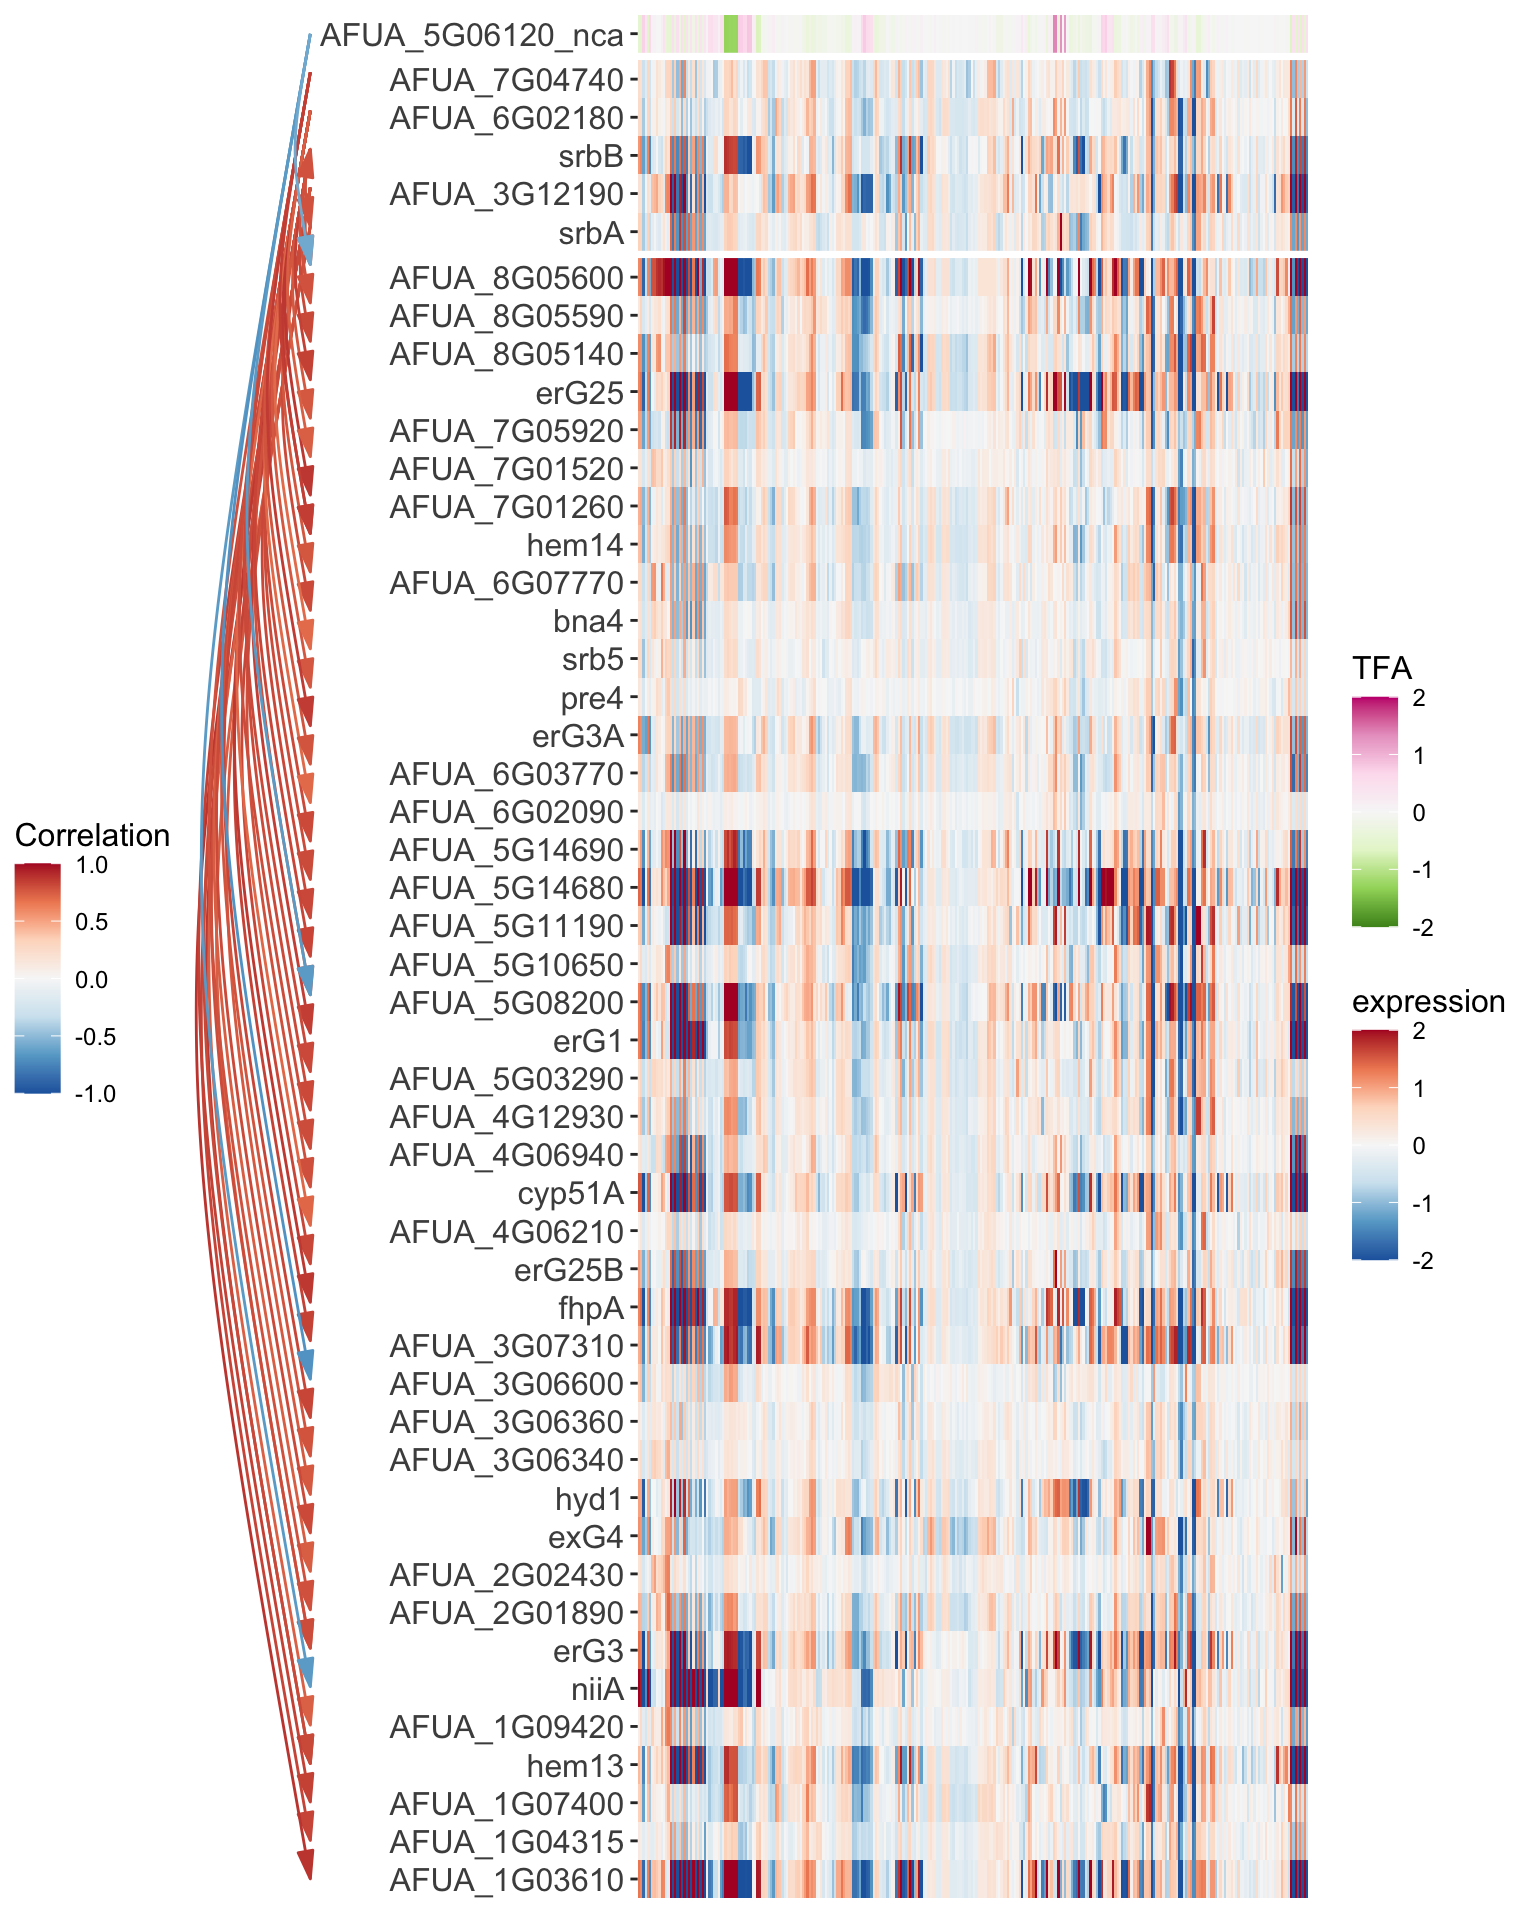
The final display option for GRAsp is the expression heatmap. The heatmap is organized into three blocks, the first is the Transcription factor activity profiles (_nca labeled genes,) followed by the cangidate regualtors, and then finally the targets. The Range of display favlues for each example is tunable with the TFA range and Expression range option respectively. Additionally the network edges are shown to the left of the heat map.
Below is the srbA module expression heatmap. The following parameters were used: - TFA color palette: PiYG
- TFA Range: (-2, 2)
- Expression color palette: RdBu
- Expression Range: (-5, 5)
- Edge color by: correlation
- Edge color palette: RdBu
CAE10 Gene Orthologs
GRAsp was designed for the Af293 strain. However, we have added some base functionality to support researches who prefer the CAE10 strain. First, we have prepared a list of 1-1 orthologs between the CAE10 and Af293 strains. CAE10 genes on the list are searchable through the Gene List search option. Most genes witihin the GRAsp network have a 1-1 ortholog in the CAE10 species (92%, 9078 1-1 orthologs). GRAsp currently does not provide support for searching by CAE10 genes which are not 1-1 orthologs, however a complete list of Af293 orthologs is included in the gene table. Additionally, the two buttons below will download the ortholog mapping used in GRASP.
Orthology methodology
We utilized orthoFinder to identify the Af293 CAE10 orthologs. We downloaded the annotated protein sequence files for A. fumigatus A1163 (CAE10) and Af293, (FungiDB version 68). We performed many-to-many alignment using the BLAST algorithm in orthoFinder. OrthoFinder constructed gene trees and orthogroups using its default algorithm. Species resolved gene trees, found in the resolved gene trees subdirectory, were processed such that branches containing at least from each species were identified as sub-orthogroups. 1-1 orthologs were defined as sub-orthogroups with exactly 1 gene from each species. 1-to-many orthogroups were identified using the entire set of sub-orthogroups. In the 1-to-many mapping, each Af293 gene was mapped to all CAE10 genes in the sub-orthogroup.
What is MERLIN
Merlin (Modular regulatory network learning with per gene information) is a computational algorithm that attempts to learn a gene regulatory network that best predicts the observed gene expression. The goal of the algorithm is to learn connection between regulators (transcription factors or other signaling encoded signaling proteins) and their target genes. To accomplish this task MERLIN builds a probabilistic graphical model which maximizes the likelihood of observing the expression data given the network structure. This is done through a greedy expectation maximization algorithm which takes a random initialization, learns distributional parameters that best describe the data, and updates iteratively until it converges to an optimal solution. For more details see the original MERLIN paper Roy et al., PLOS Computational Biology, 2013.
MERLIN is a module constrained network
Network structure prediction algorithms fall into two broad classes, per-gene and per-module algorithms. A per-gene algorithm attempts to predict regulators for each gene independently. These algorithms are powerful because they give high resolution predictions. However, given the limitations of inferring regulatory networks from data, these algorithms can produce many spurious regulatory relationships and are prone to producing false relationships. Per-module networks attempt to correct for this. Instead of learning relationships for each gene, genes are grouped into sets called modules. Regulators for each module are learned simultaneously and all genes within a module are assumed to have the same set of regulators. This technique allows the algorithm to leverage more information when making regulatory predictions but lead to lower resolution networks. In comparison to the other two methods, MERLIN falls somewhere in the middle and is considered a module constrained network. In a module constrained network, groups of genes are still clustered together into modules but regulators are learned on a per gene bases. MERLIN makes use of the module structure by encouraging a common set of regulators for genes within the same module however if the relationship between a regulator and a target is not predictive of a genes expression than the regulatory relationship is not formed. Similarly MERLIN allows for the detection of co-regulatory relationships where a particular gene may be regulated by a key module regulator and also a second regulatory factor that is gene specific.
Estimating confidence of MERLIN predictions
MERLIN learns a graphical model in greedily. This means that the optimal solution found by MERLIN may not be the absolute optimum. In fact, learning network structure falls into a class of problems called NP hard. This means that there will likely never be an efficient algorithm to determine an absolute optimal network structure. Further, the output of MERLIN depends on the random initialization, i.e. how genes are grouped into modules. Given all of this inherit variability in our prediction algorithm its an important problem to try and say which of regulatory relationships are most supported by the data. We do this through a technique called bootstrapping which allows us to estimate the confidence of a learned relationship.Bootstrapping is a common statistical technique where a model is learned on a subset of data, and compared with other inferred models. In the case of MERLIN, we randomly sample multiple subsets of RNA-seq experiments, and infer a regulatory network each time using MERLIN. We then count the number of times each edge occurs in all of our inferred models and use this as a confidence estimation. In the case of GRAsp, we are showing all edges that have occurred in 80% or more of the models.
What is the difference between MERLIN and MERLIN-P-TFA?
While MERLIN was a strong start to inferring regulatory relationship, like many other algorithms the predicted regulatory relationships did not correspond well with true relationships derived experimentally (ChIP-seq or transcription factor KO experiments). To improve the consistency of the inferred MERLIN networks, we have implemented new algorithms called MERLIN-P and MERLIN-P-TFA which leverage additional information, improve the inference of a regulatory network. The P in MERLIN-P and MERLIN-P-TFA stands for prior. These models allow the user to incorporate transcription factor binding motif, additional chIP-seq data, and KO information into the network inference algorithm which improve consistency in the network inference results. The additional information is incorporated a known prior network where hypothesized or known regulatory relationships between regulators and their target genes are included. MERLIN then learns a new regulatory network an additional term that penalizes differences between the inferred regulatory network and the prior. For more information see the original MERLIN-P paper Siahpirani A. F. and Roy S., Nucleic Acids Res. 2017. MERLIN-P-TFA takes the usage of prior information one step farther. It is well known that effects of transcription factors and their binding is not necessarily controlled by the level of active transcription of that particular transcription factor. Instead, additional factors such as phosphorylation events and ligand binding can play additional roles in the activity of transcription factors. These post transcriptional modification cannot directly be measured in RNA-seq data thus making it difficult to predict regulatory relationships.To combat this problem, MERLIN-P-TFA attempts to estimate transcription factor activity (TFA) using a method call network component analysis (NCA). The goal of this method is to use the prior network established from the additional data to infer if the regulator was active. This is done by trying to predict the expression of a gene using just the prior network. The result of this algorithm is a new profile for a subset of genes for which we have a critical threshold of prior information. This profile is an estimation of the regulators activity that is based on the data. MERLIN-P+TFA is currently unpublished but look for our paper soon.